Past Contributions: Krithik Vallem, Jiyang Zhou, Lily Zhai, Lilly Wu, Pranav Balachander, Adam Mentzer, Emily Sun, Madeline Richards, Dhanuj Gandikota, Karl Goddard, Daniel Schenider, Keerthi Sajja, Michael
Motivation:
As humans, our impact on the environment has increased significantly as our modern society continues to grow and advance. And most of the time, our “footprint” has been more harmful than helpful as things like climate change, deforestation, pollution, etc. And while effects like pollution and chemical waste dumping harm the ecosystem and the living organisms in them, it also comes back around to affect us as humans as well, in our drinking water, soil and air. Therefore, the driving force for the implementation of this heatmap was to provide a resource for users in Michigan to be able to see what areas of Michigan are contaminated with what chemicals. Additionally, by using data scraping and visualization techniques, the heatmap is able to meaningfully present a large amount of data from the EPA in a way that is quickly and easily understood.
Methods:
While the EPA provides the data for contamination sites and dates for the state of Michigan, the dataset contains hundreds of data points and is difficult to determine the impactful data. To alleviate this issue, we first used Python, through libraries such as Pandas and NumPy, to gather, analyze, and organize the EPA data into structured csv (spreadsheet-ish) files.
Afterward, the Matplotlib library was used to generate chemical heatmap images from the csv files. The heatmap images generated from this process were a significant step up from the raw EPA data, and made it very easy to look at the image and immediately see which parts of Michigan each chemical in the data was most prevalent in.
Next, we wanted to make it simple and easy for the average Michigander, who lacks the expertise to use a terminal and run several python scripts, to easily view similar, but more interactive, heatmaps from the comfort of their browser. To accomplish this, we first used Node.js to convert our csv data files into JSON. While csv files are useful for data analysis, JSON is the “lingua-franca” of the web, a far superior file format for sending and storing data on the web.
Outputs:
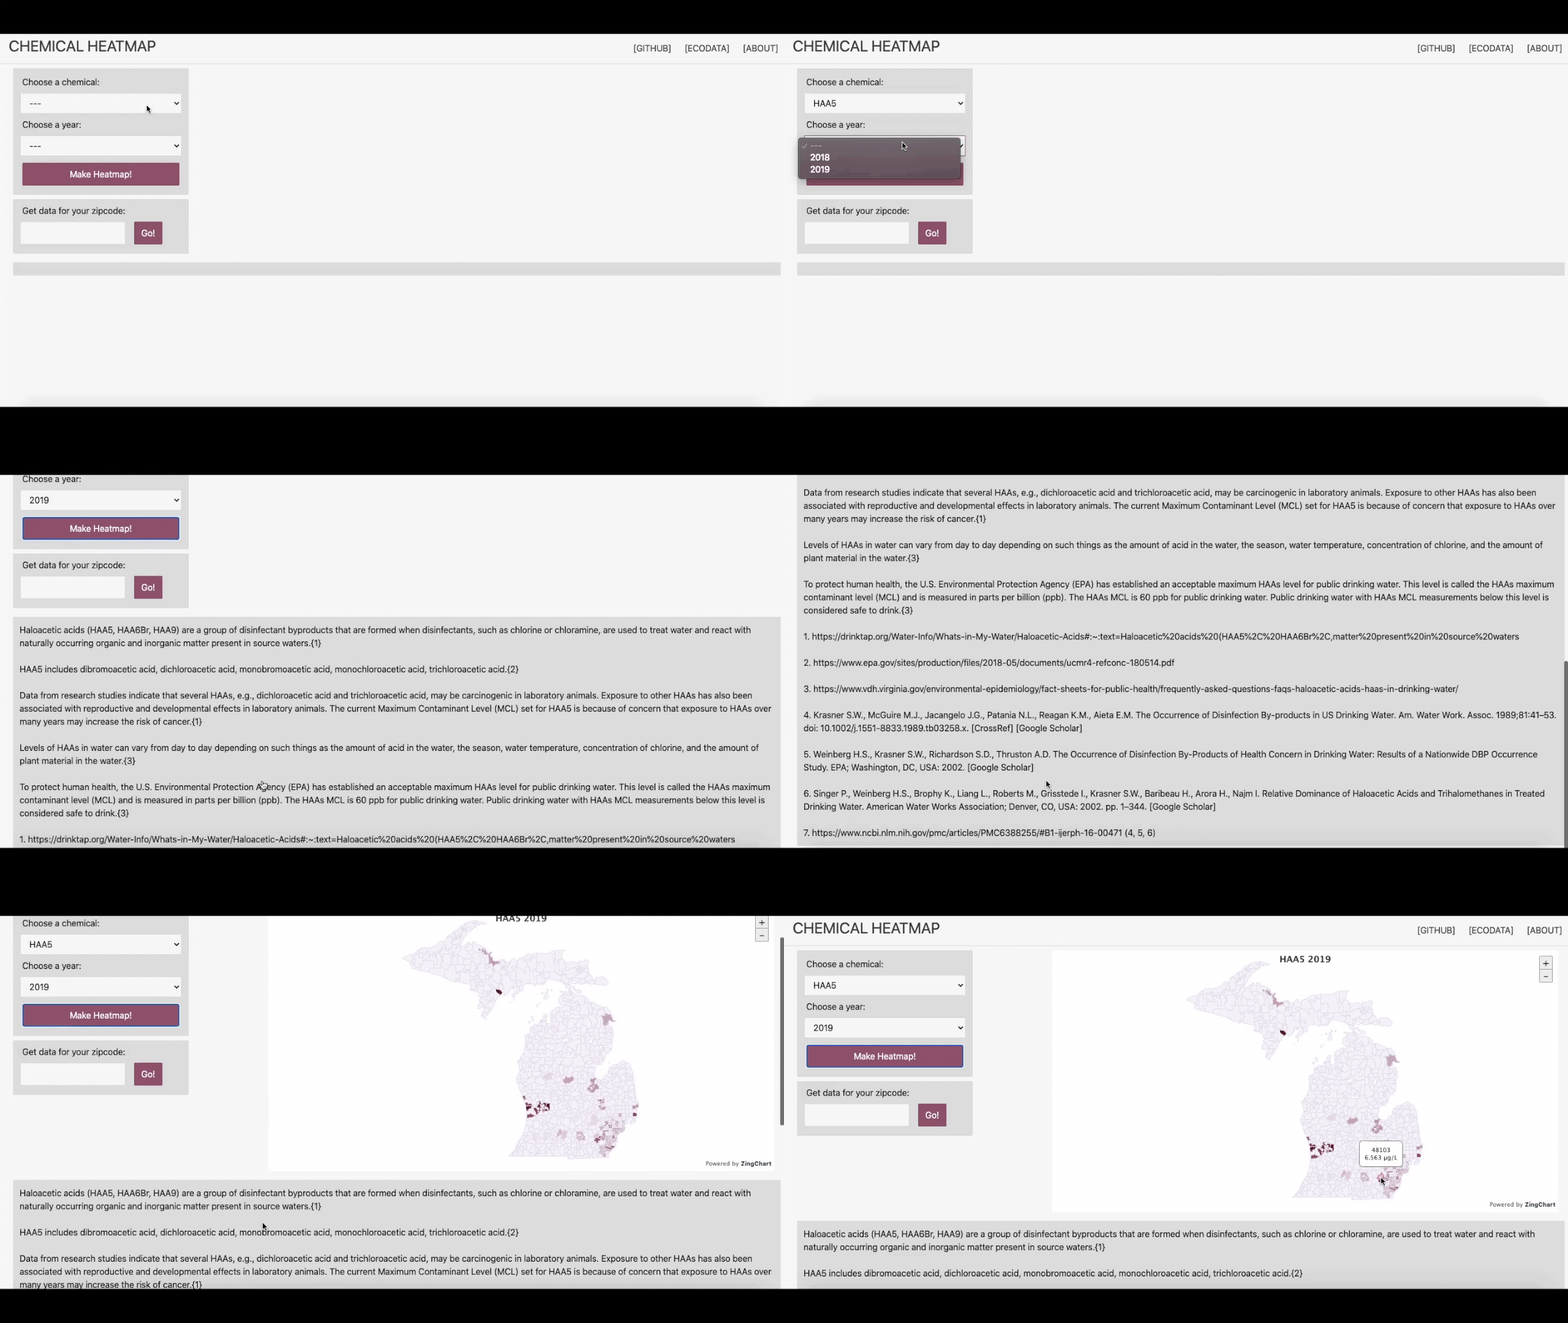
Next, we built a website, which you can check out at https://esun780.github.io/chem_heatmap.github.io/. On our website, our team used HTML and CSS to create a simple user interface using drop-down menus, buttons, pop-up reports, and more. A user can select a chemical and a year, and JavaScript, through the Zingchart library, will be used to dynamically render a heatmap right in the user’s browser. This heatmap is an interactive map of the state of Michigan, divided into regions by Zip Code. Each Zip Code is shaded in with a color representing the amount of the chosen chemical contaminant found in that Zip Code in the chosen year. This heatmap can be zoomed in on and interacted with by the user, similarly to Google Maps. The user can also hover over each region to show the respective Zip Code and if the chosen contaminant was detected in that region, the reported value of the contaminant. Furthermore, the website also displays background information about the chosen contaminant, such as its potential effects on human health, its origin, and the results of exposure to it. Finally, users can also enter their Zip Code and receive a formatted report of every chemical contaminant across every year in the dataset that was detected in the entered Zip Code.
Closing:
In conclusion, the Chemical Heatmap project was created as a meaningful way to intersect data science, computer science, and environmental/sustainability principles that would ideally positively impact users who interact with it. In addition, its functionality would also be relevant to the organization and the University’s home state. As implemented, we hope it can help inform users about the potential contaminants in their areas, inform them about the harmful effects of chemical dumping and/or improper waste disposal, and help inspire more people about sustainability efforts.
Demo:

Check out the Website!
Current news sites:
https://www.epa.gov/dwucmr/learn-about-unregulated-contaminant-monitoring-rule
